St. John Fisher University as an Enterprise
As a distinguished institution, known as Rochester’s University, Fisher contributes to the economic vitality of Monroe County, the Rochester area and New York state in several ways: as a major employer; a buyer of goods and services from businesses located in Monroe County, the Rochester area and elsewhere in New York; and as a sponsor of construction projects. This part of the report assesses Fisher’s impact as an enterprise, including the economic impact of off-campus spending by Fisher students and by visitors to Fisher. It also assesses Fisher’s impact on New York state and local government revenues.
In this section:
- Employment at Fisher
- The Impact of Purchasing and Construction
- Measuring the Multiplier Effect
- The Impact of Student and Visitor Spending
- Adding it All Up
- Contributing to State and Local Revenues
Employment at Fisher
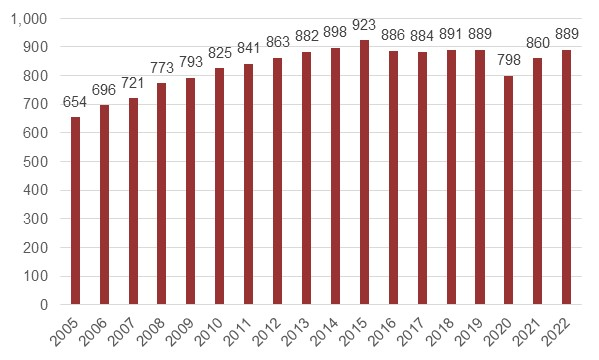
In the fall of 2022, St. John Fisher University directly employed a total of 889 people (excluding student employees), of whom approximately 64 percent worked full-time. In fiscal year 2023, Fisher paid a total of $49.4 million in salaries and wages to these employees.
As shown in Figure 1, between the fall of 2005 and the fall of 2022, total non-student employment at Fisher increased by nearly 36 percent.
In addition to these regular full- and part-time employees, Fisher employed 367 students in a variety of part-time, on-campus jobs during the fall of 2022, with wages totaling nearly $1.1 million in fiscal year 2023.
Where Fisher Employees Live
In the fall of 2022 (as shown in Figure 2), 693 Fisher non-student employees (78.0 percent of all non-student employees of St. John Fisher University) lived in Monroe County. An additional 149 (16.8 percent of Fisher’s non-student employees) lived elsewhere in the Rochester area, and 39 (4.4 percent) lived elsewhere in New York.
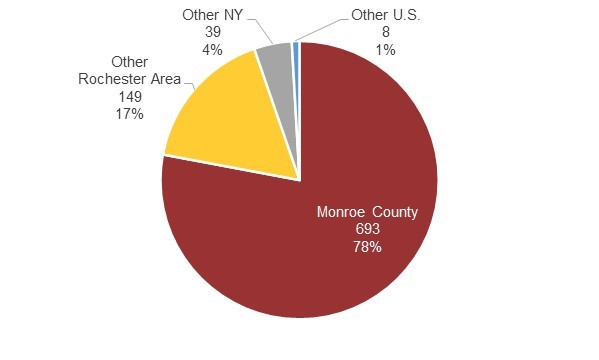
In fiscal year 2023, salaries and wages paid by Fisher to its non-student employees who lived in Monroe County totaled nearly $38.6 million (78.0 percent of Fisher’s total non-student payroll). An additional $8.1 million (16.3 percent of Fisher’s total non-student payroll) was paid to non-student employees who live elsewhere in the Rochester area, and nearly $2.2 million (4.4 percent) was paid to those who live elsewhere in New York.
Range and Quality of Fisher Employment
St. John Fisher University offers employment opportunities across a wide range of occupations – including, for example, executive and managerial positions, faculty and instructional staff, office and administrative support positions, health care practitioners and technical occupations, building and maintenance positions, and community and social service occupations.
Fisher also provides a wide range of benefits to its employees. They include:
- Health, dental, and vision insurance
- Life, accident, and disability insurance
- Flexible spending accounts
- Tax-deferred retirement plans
In addition, Fisher provides its employees with training and education opportunities. During the 2022-23 academic year, Fisher provided nearly $1.2 million in education benefits to their employees and members of their families through the University’s undergraduate and graduate tuition remission programs.
The Impact of Purchasing and Construction
On-campus investments create jobs and opportunities while enhancing Fisher’s ability to fulfill its mission and attract talented students and faculty.
In addition to the people it employs directly, St. John Fisher University supports the economies of Monroe County, the Rochester area and New York state through its purchases of goods and services from local businesses, and through construction and renovation of its campus facilities.
Purchasing Goods and Services
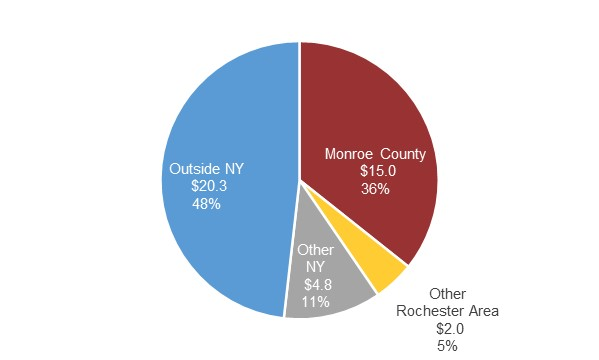
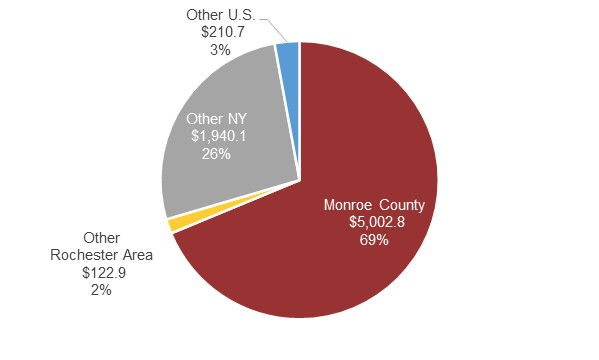
In fiscal year 2023, St. John Fisher University spent nearly $40.2 million on the purchase of goods and services (excluding construction). Of this total (as shown in Figure 3), more than $15.0 million (35.7 percent of total purchasing) was spent on goods and services provided by businesses located in Monroe County, an additional $2.0 million (4.8 percent) was spent on goods and services provided by businesses located elsewhere in the Rochester area, and nearly $4.8 million (11.4 percent) was spent on purchases from businesses located elsewhere in New York.1
Leading categories of goods and services purchased from businesses in New York in fiscal year 2023 included:
- Professional and technical services
- Employee health insurance
- Utilities
- Travel and meals
- Building services and facilities support
Using the IMPLAN input-output economic modeling system – a modeling tool commonly used in economic impact analyses – we estimate that in fiscal year 2023, Fisher’s purchases of goods and services directly supported 90 jobs in Monroe County, 16 additional jobs elsewhere in the Rochester area, and 15 additional jobs elsewhere in New York.
Construction and Renovation of Facilities
In addition to generating jobs and economic activity through its purchases of goods and services, St. John Fisher University also does so through its investments in its campus facilities. As shown in Figure 4, between fiscal year 2012 and fiscal year 2023, Fisher invested approximately $99.8 million in facility construction and renovation.
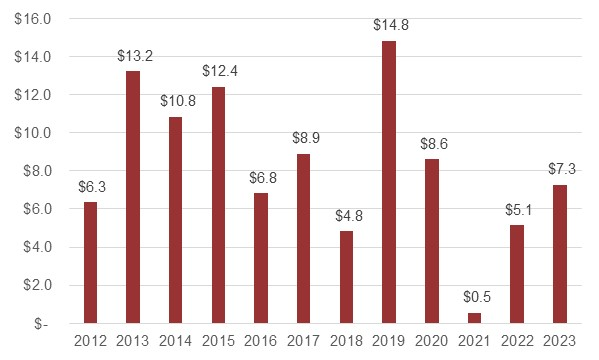
In fiscal year 2023 (as shown in Figure 5), Fisher spent nearly $7.3 million on construction and renovation of facilities, of which more than $5.0 million (68.8 percent of total construction spending) was paid to contractors and other vendors located in Monroe County, and an additional $2.1 million (28.4 percent of total construction spending) was paid to contractors and other vendors located elsewhere in the Rochester area and New York.
Using IMPLAN, we estimate that in fiscal year 2023, Fisher’s spending on construction and renovation of facilities directly supported 26 jobs with companies in construction and related industries in Monroe County, and 10 additional jobs with companies in construction and related industries located elsewhere in the Rochester area and New York.
Measuring the Multiplier Effect
The jobs and economic activity generated by St. John Fisher University’s spending on payroll, purchasing and construction are not limited to the direct impacts cited above. Using a tool of economic analysis called an input-output model, we can also estimate the indirect and induced (or “multiplier”) effects of spending by Fisher. For example:
-
Some of the money that Fisher pays to its local suppliers and contractors is used to buy goods and services from other local companies, which in turn buy goods and services from other local businesses (the indirect effect).
-
Fisher employees, and the employees of its suppliers and contractors, similarly use part of their earning to buy a wide variety of goods and services, such as housing, utilities, food, and other personal services, from local businesses; the employees of those businesses do the same (the induced effect).
Using IMPLAN, we estimate that in fiscal year 2023, spending by Fisher on non-student payroll, purchasing and construction indirectly accounted for:
- 243 jobs in Monroe County, with earnings totaling nearly $14.5 million
- Nearly $43.0 million in countywide economic output
In the Rochester area (including Monroe County), Fisher’s spending indirectly accounted for:
- 268 jobs in the Rochester area, with earnings totaling $15.6 million
- Nearly $46.9 million in regional economic output
Statewide (including the Rochester area), Fisher’s spending indirectly accounted for:
- 294 jobs in New York, with earnings totaling $17.8 million
- $52.8 million in statewide economic output
Combining these indirect and induced effects with the direct effects cited previously, we estimate that in fiscal year 2023, spending by St. John Fisher University on non-student payroll, purchasing and construction directly and indirectly accounted for:
- 1,248 jobs in Monroe County, with earnings totaling $72.1 million
- Nearly $112.8 million in countywide economic output
In the Rochester area (including Monroe County), Fisher’s spending directly and indirectly accounted for:
- 1,290 jobs in the Rochester area, with earnings totaling more than $74.0 million
- Nearly $118.6 million in regional economic output
Statewide (including the Rochester area), Fisher’s spending directly and indirectly accounted for:
- 1,340 jobs in New York, with earnings totaling nearly $78.8 million
- $130.8 million in statewide economic output
Tables 1, 2 and 3 summarize the total impact of Fisher’s spending on non-student payroll, purchasing and construction in Monroe County, the Rochester area (including Monroe County) and New York (including the Rochester area).
Table 1: Spending Impacts in Monroe County
Direct, indirect, and induced impacts of Fisher’s spending in Monroe County, FY 2023 (wages and output in $000s)
| Jobs | Wages | Output | |
| Direct spending impact | |||
| Payroll | 889 | $49,436.30 | $49,436.30 |
| Purchasing/construction | 116 | $8,178.10 | $20,368.50 |
| Subtotal, direct impact | 1,005 | $57,614.40 | $69,804.80 |
| Indirect and induced effects | |||
| Employee spending | 164 | $9,524.60 | $27,699.10 |
| Contractor and vendor spending | 80 | $4,971.40 | $15,265.40 |
| Subtotal, indirect/induced effects | 243 | $14,496.00 | $42,964.50 |
| Total impact | 1,248 | $72,110.30 | $112,769.40 |
Table 2: Spending Impacts in Rochester Area
Direct, indirect, and induced impacts of Fisher’s spending in the Rochester area, FY 2023 (wages and output in $000s)
| Jobs | Wages | Output | |
| Direct spending impact | |||
| Payroll | 889 | $49,436.30 | $49,436.30 |
| Purchasing/construction | 132 | $8,938.70 | $22,276.80 |
| Subtotal, direct impact | 1,021 | $58,375.00 | $71,713.10 |
| Indirect and induced effects | |||
| Employee spending | 183 | $10,423.40 | $30,694.40 |
| Contractor and vendor spending | 85 | $5,225.60 | $16,186.60 |
| Subtotal, indirect/induced effects | 268 | $15,649.00 | $46,881.10 |
| Total impact | 1,290 | $74,024.00 | $118,594.10 |
Table 3: Spending Impacts in New York
Direct, indirect, and induced impacts of Fisher’s spending in New York, FY 2023 (wages and output in $000s)
| Jobs | Wages | Output | |
| Direct spending impact | |||
| Payroll | 889 | $49,436.30 | $49,436.30 |
| Purchasing/construction | 157 | $11,617.60 | $28,581.80 |
| Subtotal, direct impact | 1,046 | $60,953.90 | $78,018.10 |
| Indirect and induced effects | |||
| Employee spending | 192 | $11,043.10 | $32,358.50 |
| Contractor and vendor spending | 102 | $6,763.00 | $20,461.90 |
| Subtotal, indirect/induced effects | 294 | $17,806.20 | $52,820.40 |
| Total impact | 1,340 | $78,760.00 | $130,838.60 |
The Impact of Student and Visitor Spending
In addition to the impact of its spending on non-student payroll, purchasing and construction, St. John Fisher University contributes to the economic vitality of Monroe County through off-campus spending by Fisher students and by out-of-town visitors to Fisher’s campus.
The Impact of Student Spending
The impact of student spending is determined in part by whether students live on- or off-campus in Monroe County and the surrounding Rochester area. During the fall of 2022, approximately 47 percent of all undergraduate students lived in Fisher-owned housing, while nearly all graduate students lived off-campus.
In analyzing the impact of off-campus student spending in Monroe County, this report counts only spending by full-time undergraduate and graduate students from outside of Monroe County; at the regional level, only spending by full-time undergraduate and graduate students from outside of the Rochester area; and at the state level, only spending by full-time undergraduate and graduate students from outside of New York. While relatively conservative, this approach helps ensure that we are not claiming as part of Fisher’s impact spending that could still have occurred within Monroe County or elsewhere in New York even if these students had not been attending St. John Fisher University.
Based on data provided by St. John Fisher University on the average annual cost of living for students – on housing, food, transportation, books, supplies, and personal expenses – we estimate that during fiscal year 2023, off-campus spending by full-time Fisher students from outside of Monroe County totaled $10.9 million, most of which was spent in Monroe County. Using IMPLAN, we estimate that this spending directly and indirectly accounted:
- 93 jobs in Monroe County, with earnings totaling nearly $3.5 million
- $12.1 million in countywide economic output
We similarly estimate that in fiscal year 2023, off-campus spending by full-time Fisher students from outside of the Rochester area totaled nearly $8.8 million. Using IMPLAN, we estimate that this spending directly and indirectly accounted for:
- 75 jobs in Monroe County, with earnings totaling nearly $2.8 million
- Nearly $9.8 million in countywide economic output
For students who came to Fisher from outside of New York, we estimate that during fiscal year 2023, off-campus spending in Monroe County totaled approximately $791,300. Using IMPLAN, we estimate that this spending directly and indirectly accounted for:
- 7 jobs in Monroe County, with earnings totaling $266,885
- Approximately $867,400 in countywide economic output
The Impact of Visitor Spending
St. John Fisher University also attracts out-of-town visitors to its campus who then spend money within the local economy. As shown in Table 4, Fisher estimates that during the 2022-23 academic year, approximately 88,950 people visited the Fisher campus – for admission visits, commencement, alumni events, athletic events, performances, the Buffalo Bills Training Camp, and other purposes.
Table 4: Visitors to Fisher by purpose of visit, 2022-23 academic year
| Purpose of visit | Total visitors |
| Pre-enrollment visits | 8,147 |
| Admitted student visits | 1,888 |
| Other Admissions programs | 211 |
| Alumni visits/homecoming | 573 |
| Commencement | 7,415 |
| Academic conferences/lectures | 1,892 |
| Entertainment/performances | 4,480 |
| Museum/exhibitions | 650 |
| RCSD Summer School | 161 |
| Athletic events | 18,800 |
| Buffalo Bills Training Camp | 44,734 |
| Total | 88,951 |
Of these visitors, Fisher estimates that approximately 49,120 (55 percent of all visitors) came from outside Monroe County, including 25,550 (29 percent of all visitors) from elsewhere in the Rochester area, 19,980 (22 percent) from elsewhere in New York, and 3,590 (4 percent) from outside of New York.
Using data on visitor spending compiled by the Finger Lake Tourism Alliance, we estimate that during fiscal year 2023, off-campus spending in Monroe County by visitors to Fisher from outside of Monroe County – on hotel accommodations, food, shopping, entertainment, and transportation – totaled nearly $7.8 million. Using IMPLAN, we estimate that this spending directly and indirectly accounted for:
- 96 jobs in Monroe County, with earnings totaling nearly $3.9 million
- $10.8 million in countywide economic output
We similarly estimate that in fiscal year 2023, off-campus spending in Monroe County by visitors to Fisher from outside of the Rochester area totaled nearly $5.2 million. Using IMPLAN, we estimate that this spending directly and indirectly accounted for:
- 63 jobs in Monroe County, with earnings totaling $2.6 million
- Nearly $7.3 million in countywide economic output
For visitors to Fisher who came from outside of New York, we estimate that during fiscal year 2023, off-campus spending in Monroe County totaled approximately $1.3 million. Using IMPLAN, we estimate that this spending directly and indirectly accounted for:
- 6 jobs in Monroe County, with earnings totaling approximately $678,770
- Nearly $1.9 million in countywide economic output
Adding it All Up
Combining the impact of St. John Fisher University’s spending on non-student payroll, purchasing and construction with the impact of off-campus student and visitor spending, we estimate that in fiscal year 2023, Fisher directly and indirectly accounted for:
- 1,438 jobs in Monroe County, with earnings totaling nearly $79.5 million
- $135.7 million in countywide economic output
In the Rochester area (including Monroe County), we estimate that spending by Fisher, its students and visitors to the campus directly and indirectly accounted for:
- 1,427 jobs in the Rochester area, with earnings totaling $79.4 million
- $135.6 million in regional economic output
Statewide (including the Rochester area), we estimate that spending by Fisher, its students and visitors to the campus directly and indirectly accounted for:
- 1,363 jobs in New York, with earnings totaling $79.7 million
- Nearly $133.6 million in statewide economic output
These combined impacts in Monroe County, the Rochester area (including Monroe County) and New York (including the Rochester area) are summarized below in Tables 5, 6 and 7.
Table 5: Total Spending Impact Monroe County
Total impact of spending by Fisher, students and visitors in Monroe County, FY 2023 (wages and output in $000s).
| Jobs | Wages | Output | |
| Impact of Fisher spending | |||
| Direct | 1,005 | $57,614.40 | $69,804.80 |
| Indirect/induced | 243 | $14,496.00 | $42,964.50 |
| Subtotal, university spending impact | 1,248 | $72,110.30 | $112,769.40 |
| Impact of student spending | |||
| Direct | 71 | $2,109.50 | $8,033.80 |
| Indirect/induced | 22 | $1,352.30 | $4,104.90 |
| Subtotal, student spending impact | 93 | $3,461.80 | $12,138.70 |
| Impact of visitor spending | |||
| Direct | 72 | $2,369.80 | $6,271.30 |
| Indirect/induced | 25 | $1,519.50 | $4,547.50 |
| Subtotal, visitor spending impact | 96 | $3,889.30 | $10,818.80 |
| Total impact | 1,521 | $79,461.50 | $135,726.80 |
Table 6: Total Spending Impact Rochester Area
Total impact of spending by Fisher, students and visitors in the Rochester area, FY 2023 (wages and output in $000s)2
| Jobs | Wages | Output | |
| Impact of Fisher spending | |||
| Direct | 1,021 | $58,375.00 | $73,926.20 |
| Indirect/induced | 268 | $15,649.00 | $50,646.30 |
| Subtotal, university spending impact | 1,290 | $74,024.00 | $124,572.50 |
| Impact of student spending | |||
| Direct | 58 | $1,706.90 | $6,388.00 |
| Indirect/induced | 18 | $1,092.10 | $3,213.40 |
| Subtotal, student spending impact | 75 | $2,799.10 | $9,601.40 |
| Impact of visitor spending | |||
| Direct | 46 | $1,608.80 | $4,237.40 |
| Indirect/induced | 17 | $1,013.30 | $3,020.90 |
| Subtotal, visitor spending impact | 63 | $2,622.00 | $7,258.30 |
| Total impact | 1,427 | $135,613.70 | |
Table 7: Total Spending Impact New York
Total impact of spending by Fisher, students and visitors in New York, FY 2023 (wages and output in $000s)
| Jobs | Wages | Output | |
| Impact of Fisher spending | |||
| Direct | 1,046 | $60,953.90 | $78,018.10 |
| Indirect/induced | 294 | $17,806.20 | $52,820.40 |
| Subtotal, university spending impact | 1,340 | $78,760.00 | $130,838.60 |
| Impact of student spending | |||
| Direct | 5 | $164.20 | $556.80 |
| Indirect/induced | 2 | $102.60 | $310.60 |
| Subtotal, student spending impact | 7 | $266.90 | $867.40 |
| Impact of visitor spending | |||
| Direct | 11 | $419.40 | $1,099.50 |
| Indirect/induced | 4 | $259.40 | $770.20 |
| Subtotal, visitor spending impact | 16 | $678.80 | $1,869.70 |
| Total impact | 1,363 | $79,705.70 | $133,575.70 |
Contributing to State and Local Revenues
Despite its tax-exempt status, St. John Fisher University contributes to state and local government finances in a variety of ways. As shown in Table 8, in fiscal year 2023, state and local taxes and fees paid by Fisher included:
- Nearly $2.3 million in state and local income taxes withheld from the salaries and wages of Fisher employees;
- $31,750 in unemployment insurance taxes;
- $69,769 in water and sewer fees; and
- $17,496 in other taxes and fees paid to state and local governments.
Overall, in fiscal year 2023, St. John Fisher University directly accounted for nearly $2.4 million in state and local government revenues.
Table 8: Taxes and fees
Taxes and fees paid by Fisher to New York state and local governments, FY 2023
| Type of tax/fee | Amount |
| State revenues | |
| State income taxes withheld | $2,264,580 |
| Unemployment insurance taxes | $31,750 |
| Other state taxes and fees | $550 |
| Subtotal, state revenues | $2,296,881 |
| Local government revenues | |
| Real property taxes on non-exempt property | $2,081 |
| Water/sewer fees | $69,769 |
| Other local taxes and fees | $86,715 |
| Subtotal, local government revenues | $90,080 |
| Total state and local revenues | $2,383,596 |
1For purposes of calculating the economic impact of St. John Fisher University spending, employee health insurance is treated as a purchased service, allocated according to full-time employees’ place of residence.
2As might be expected, the impact of Fisher’s spending on payroll, purchasing and construction is somewhat greater at the regional level than at the Monroe County level, and greater at the state level than at the regional level. However, since in analyzing the impact of student spending we include only spending by students from outside Monroe County (at the county level), from outside the greater Rochester area (at the regional level) or from outside New York state (at the state level), the impact of student spending is greater at the county level than at the regional and state levels. As a result, the combined impacts of Fisher, student and visitor spending shown in Tables 5, 6 and 7 are slightly greater at the county level than at the regional and state levels.